Multivariate Real-Time Monitoring and Data Analysis

WHAT IS THE PROBLEM?
The collection and analysis of multivariate data in real time is a challenge facing many analysts responsible for process quality control or feedback control. Two issues stand out:
1. How to collect data in real time , and
2. How to integrate such data into software that can process the data.
It is of minimal utility if analysts can collect data in real time but cannot interpret the data in real time. Similarly if the data can be analyzed rapidly but cannot be collected rapidly, the benefits of real time data collection are all but lost.
This is problematic if the sample data are limited to single or uni-variate information. In today's data monitoring environment, data analysis in many cases involves the collection and interpretation of multivariate data The collection and simultaneously interpretation of such data in real-time is the challenge of the current data management environment.
HOW DO WE DO HELP? WITH SAM!!!
To process and analyze continuously flowing multivariate data, we have developed special software that can automatically collect, store and process multivariate data on the fly (in real time). The models convert the raw input data into a useful output for the analyst. We call this special software package SAM (or SAMPLE ANALYTICAL MODULE).
HOW DO WE WORK TOGETHER?
If you have an application where near-real time analysis of chemometric or complex multivariate data would be beneficial for quality and process control, contact us to determine whether we can help. We license our existing applications and will assist in developing new applications to meet your needs if necessary.
WHAT ARE YOUR BENEFITS?
If you have the need for near-real time process control, our models have the unique capability to process (on the fly) continuous sample data input and provide real-time output. Each sample can contain thousands of independent variables that are screened to generate a dependent output. Data input could be process parameters (temperature, pressure, etc.) spectroscopic (wavelength and intensity),, etc. Dependent variable output could be product quality, material composition, The results are provided in near real -time. Our model development is especially geared to bulk production process data, typically associated, but not limited to, the mining, cement, aggregate, waste and recycling industries.
NEW APPLICATION?
Since multivariate modeling and analysis is a new analytical tool in many process l applications, please contact us to discuss whether our models can fit your data monitoring needs.
Modeling Services Overview
Partial Least Square Regression
Partial Least Square Regression
Partial Least Square Regression

Principal Components Analysis
Partial Least Square Regression
Partial Least Square Regression
Hierarchical Clustering
Partial Least Square Regression
Hierarchical Clustering
What is SAM and What Does it Do?

- SAM is a proprietary software package that grabs real time multivariate sample data as it is collected and processes the data to generate a predefined output that is transmitted back to the User providing information to evaluate incoming data on the fly.
- SAM was specially designed to handle continuously generated spectral emission data in real-time. This has direct applicability to laser scanning applications where rapid repetition rate lasers can generate spectral data at rates of 1-10 hz.
- SAM will process and model real-time spectral data on the fly and return the modeled results to the operator within minutes.
- While SAM was developed to process real-time spectral data it can process and analyze any multivariate data set that generates a continuously flow of data. It is especially suited for monitoring industrial processes, stock market data, survey data etc,,,
Univariate, Bivariate and Multivariate Analysis
Univariate and Bivariate Data Analysis:
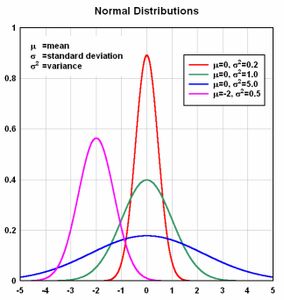
When we use one variable to describe a person, place, or thing this is a univariate or one dimensional analysis. The weight for example of each person in a group would constitute the single variable in a univariate analysis. We can calculate the mean weight of the group, the standard deviation of the weight and develop a statistical distribution to evaluate the data that might be helpful in predicting the the expected weights in similar groups.
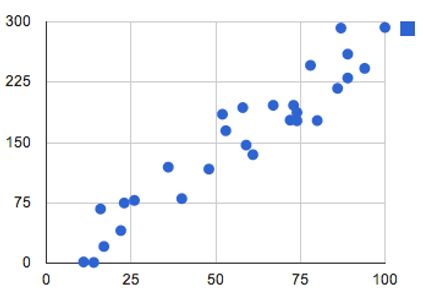
A bivariate or two dimensional analysis, analysis would include the use of two variables. It is the simplest form of a multivariate analysis. For example if we wanted to correlate the relationship between height and weight in the group, that would be a bivariate analysis. We could develop from these data regression equation.that could be used as a predictive tool that would permit us to estimate the weight of persons with known heights.
Multivariate Analysis
Complex manmade or natural systems can rarely be predicted on the basis of one or two variables. Imagine attempting to track the price of stocks or the weather or chemical and biological systems or most industrial processes on the basis of one or two variables.
This is where Multivariate (multi-dimensional) Analysis comes in.
In the past the use of multivariate analysis was limited by the complex mathematical computations that were not practical to undertake. Today however we have the tools to project our data into multidimensional space and analyze relationships among thousands of variables.
Multivariate analysis is especially suited for spectroscopic analysis where a light spectrum containing 1000's of wavelengths can help define the chemical makeup of an analyzed material. A whole new field called chemometrics has evolved from multivariate spectral analysis,

Multivariate analysis or modeling is the new math that will be applied and deployed in industries where data collection, management and interpretation is part of their overall business plan and model.